From Hatchfield et al. 2025 in prep: This map of the simulated Galactic Center shows a face-on view of the Central Molecular Zone and the Dust Lanes that feed material inwards. The color-scale shows gas surface density, using an arbitrary scaling for the purposes of visual aesthetics, though the to-be-published version includes a density scale-bar. In the regions of low density (white and black in the color-scale), some of the adaptive grid artifacts are visible as polygonal regions of uniform density.
From Hatchfield et al. 2021: This figure offers a new perspective on how clouds in the Galactic center accumulate material. Imagine a cloud of gas at simulation time ~180 Myr. By following the unique tracer particles associated with the parcels of mass that make up that cloud, we can follow them back in time and see where they were in previous snapshots (in terms of their distance from the galaxy center as shown on the y-axis). As a result, we can see how material approaches the Galactic center before “bouncing back”, overshooting the Central Molecular Zone before being eventually integrated into the molecular ring at R~100pc.
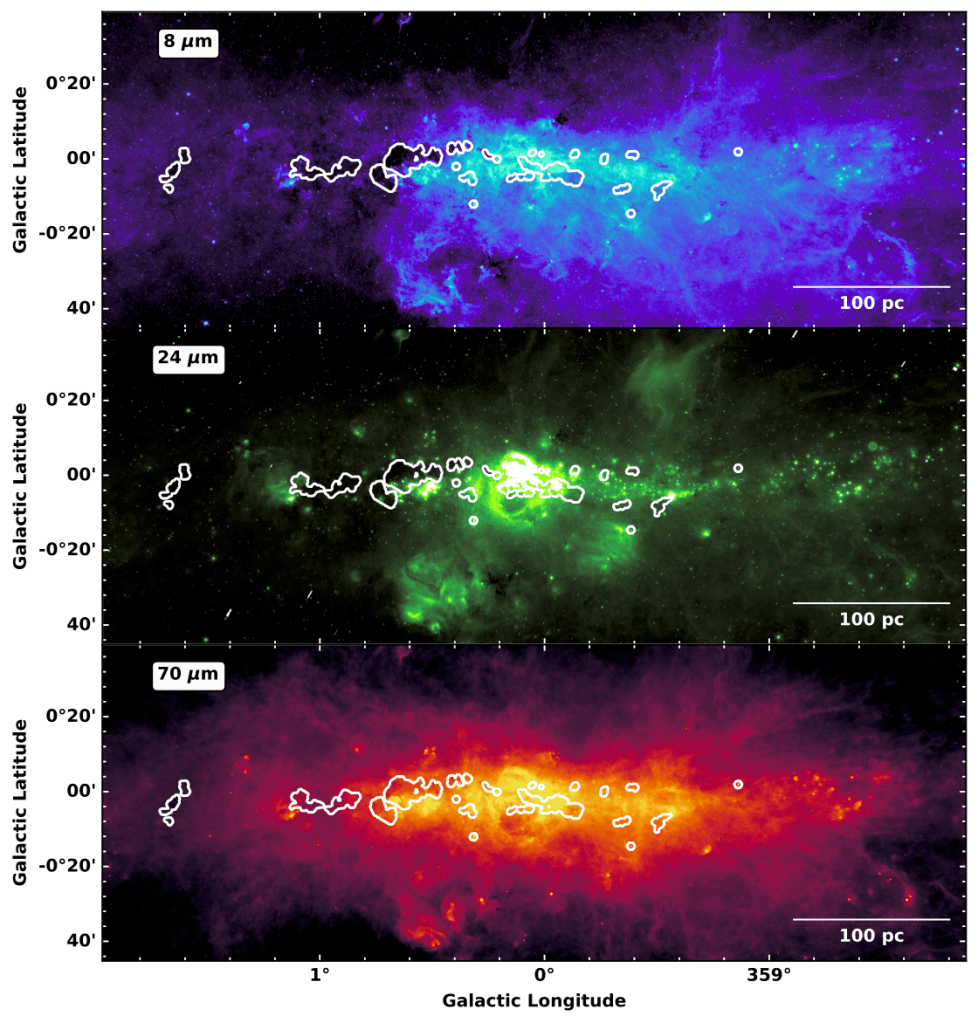
From Hatchfield et al. 2024: A threefold view of our Galactic Center, at 8 microns (top) and 24 microns (middle) from the Spitzer Space Telescope, and at 70 microns (bottom) from the Herschel Space Observatory. Different features of the gas appear at different frequencies, with hotter material generally shining at shorter wavelengths and the colder, dense gas structures glowing more in the far infrared detected by Herschel. The CMZoom survey footprint is overlaid in white, showing the regions searched for dense gas structures by our team’s cataloging effort (Battersby et al. 2020, Hatchfield et al 2020, Callanan et al 2023). A Position Velocity Diagram (PV diagram) of the Galactic Center in a hydrodynamic simulation of the Milky Way.